Sunday Survey / What Do You Think About Last Night's Military Action?
And, a special report on last week's Consumer Sentiment Survey

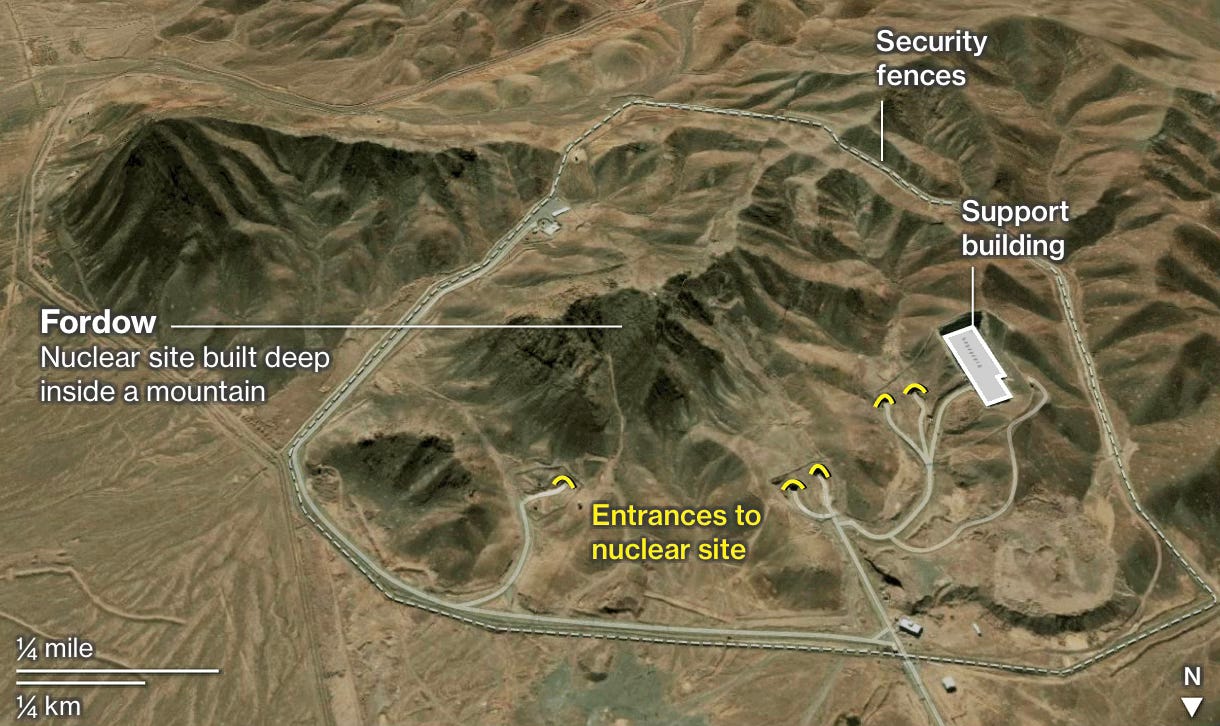
Fordo - One of Iran’s Nuclear Sites
Few if any Presidential decisions are easy. There are normally strong arguments on both sides coming from many quarters. The active engagement of the U.S. military has proven over time to provide the most difficult set of options for Presidents.
Without a doubt, President Trump’s decision about our role in the Iran situation poses what are and likely will remain some of the greatest challenges of his presidency.
So, I’m curious, what would you have advised?
A Special Report on Consumer Sentiment
Last week, questions used by the University of Michigan formed our Sunday Survey. Working with my AI analyst, responses from DECADE SEVEN readers were put through the long-used formula.
Here is a special report.
DECADE SEVEN REPORT
June 2025
Last week, we took the pulse of our DECADE SEVEN community to see how you're feeling about the economy, your financial footing, and the road ahead.
The results are sobering.
Using the University of Michigan’s trusted method for calculating consumer sentiment, here’s what DECADE SEVEN readers told us in June:
📊 Consumer Sentiment Index (ICS): 39.75
📉 Current Conditions Index (ICC): 21.83
🔮 Expectations Index (ICE): 19.91
These figures fall deep into “crisis-level” territory. For comparison, scores below 50 have historically only appeared during the worst economic periods—like the 2008 financial crash or early 1980s recessions.
What These Numbers Say
Sentiment is collapsing: Our readers feel worse about the economy than they did during the height of the pandemic.
The present feels bad, but the future looks worse: The Expectations Index is lower than the Current Conditions Index—signaling widespread pessimism about what lies ahead.
Crisis of trust: This is more than just a reaction to prices or politics. It’s a reflection of diminished faith in economic stability.
Why It Matters
While Wall Street may cheer strong stock reports or job data, our participating readers see things differently. You’ve weathered decades of market cycles. When you say something feels off—it likely is.
Your views influence spending, voting, and investment behavior. This isn’t just a data point—it’s a warning light.
As a Reference Point / National Data Over Time from the University of Michigan Study
The chart below shows University of Michigan data going back to 1980. It is provided in a report issued by the St. Louis Federal Reserve Bank. For their report, CLICK HERE.
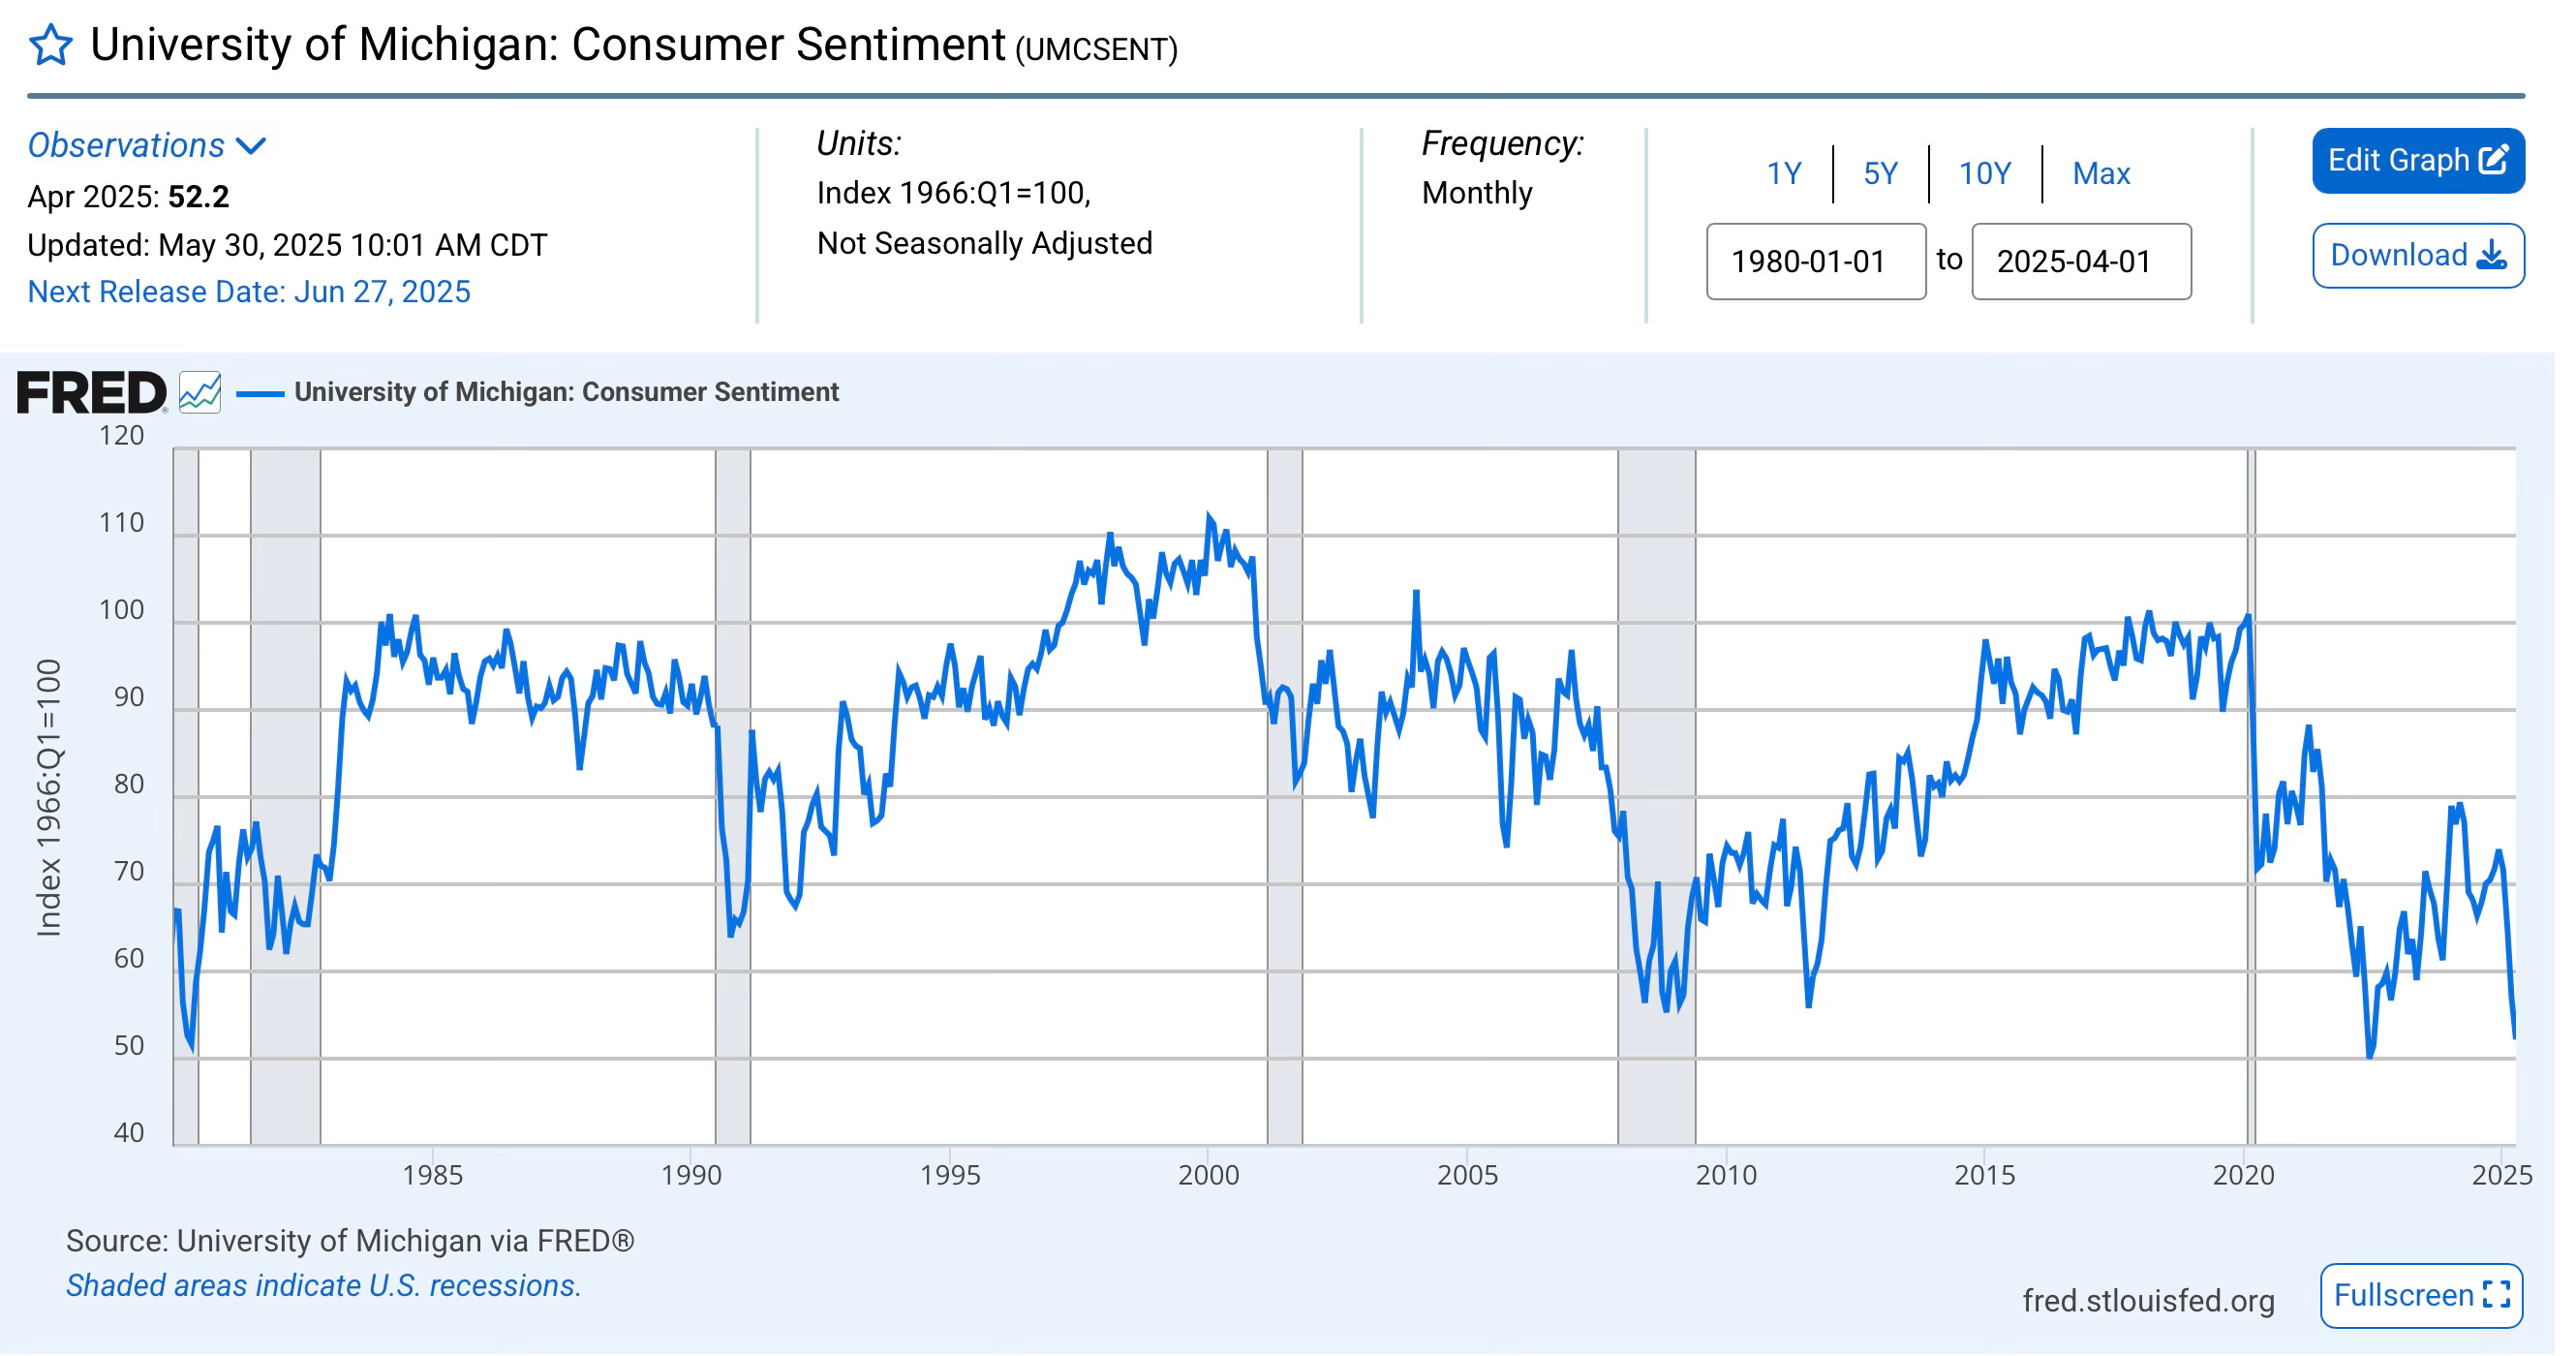
And, HERE is the June report from the University of Michgan’s national survey.
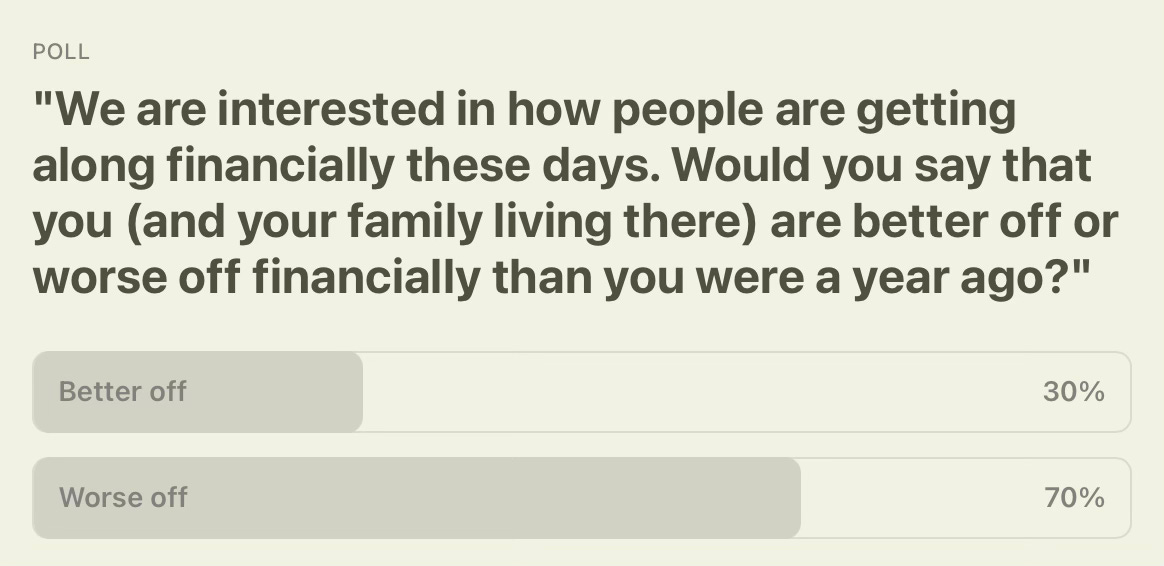
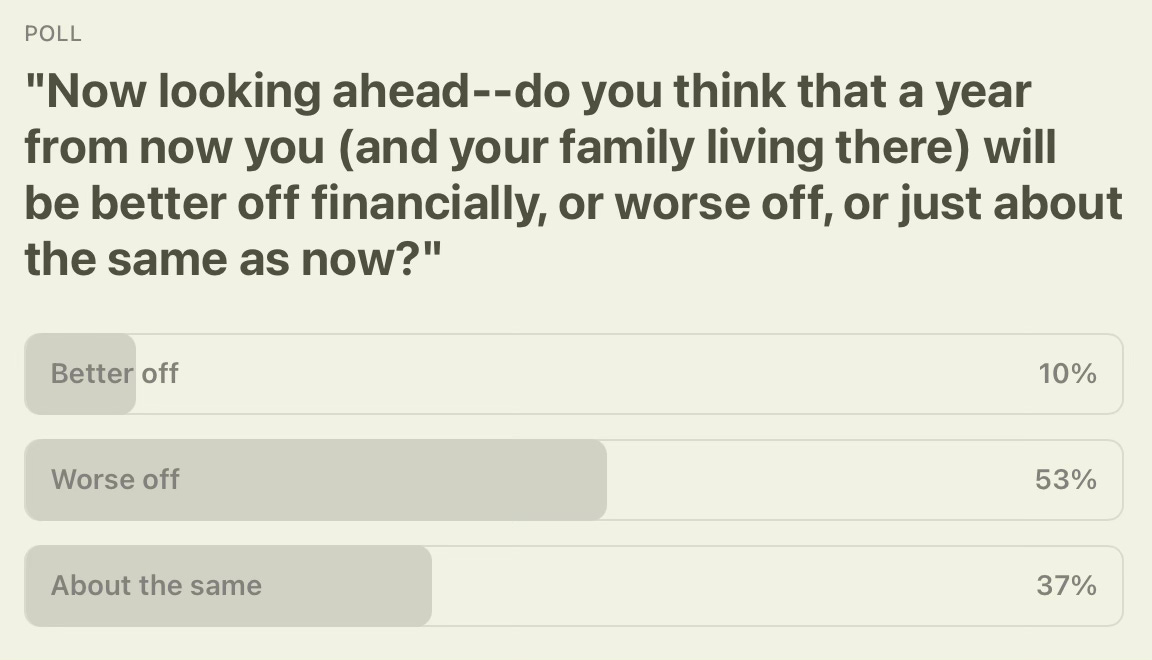
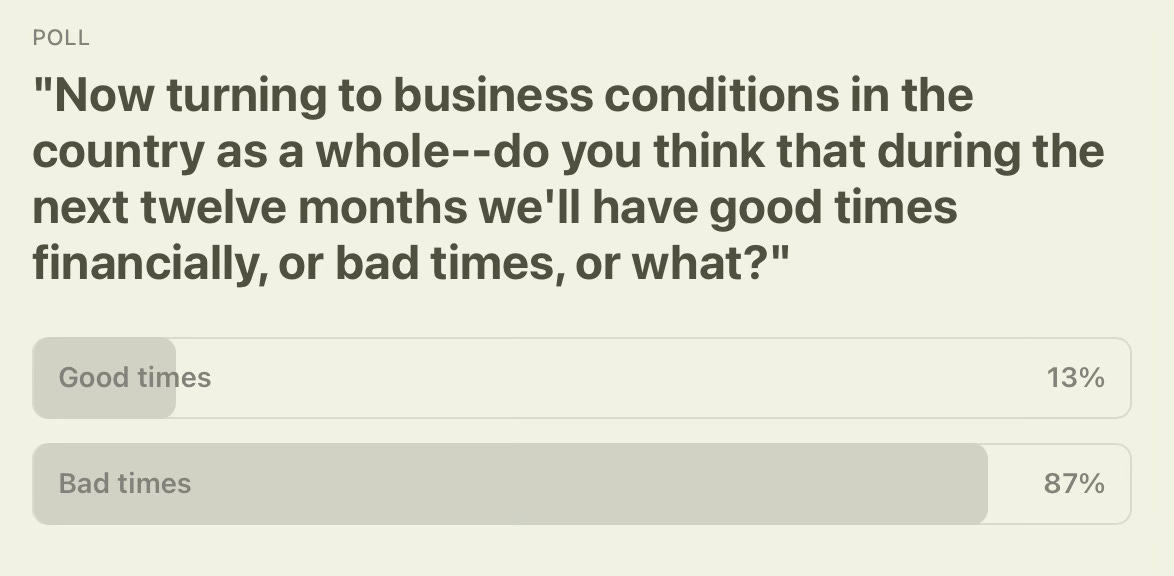
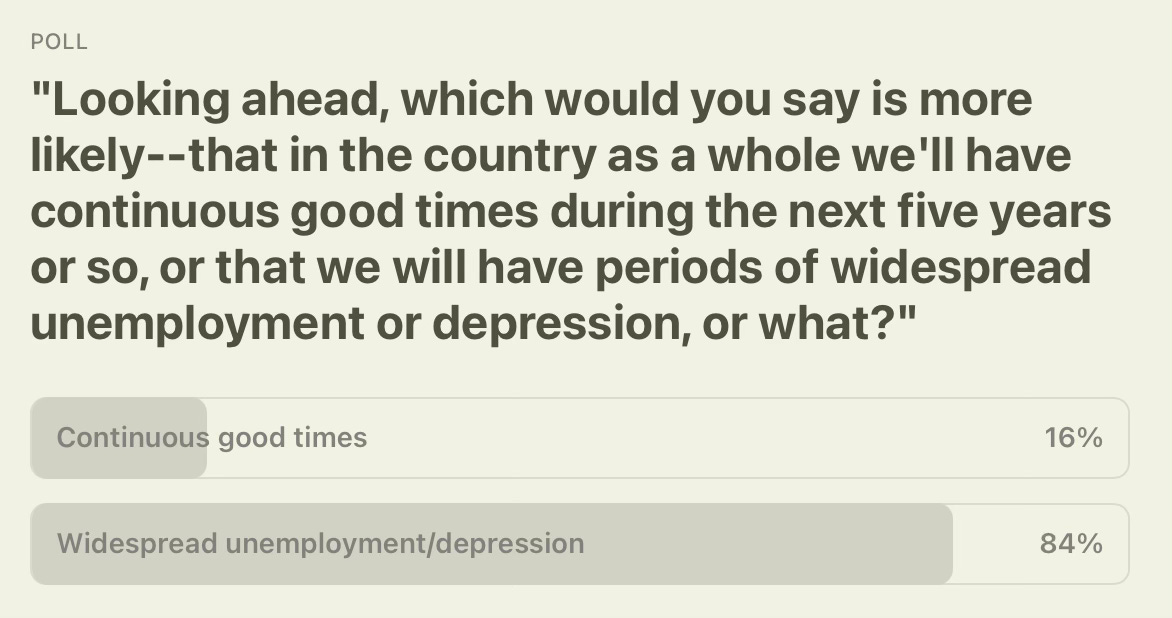
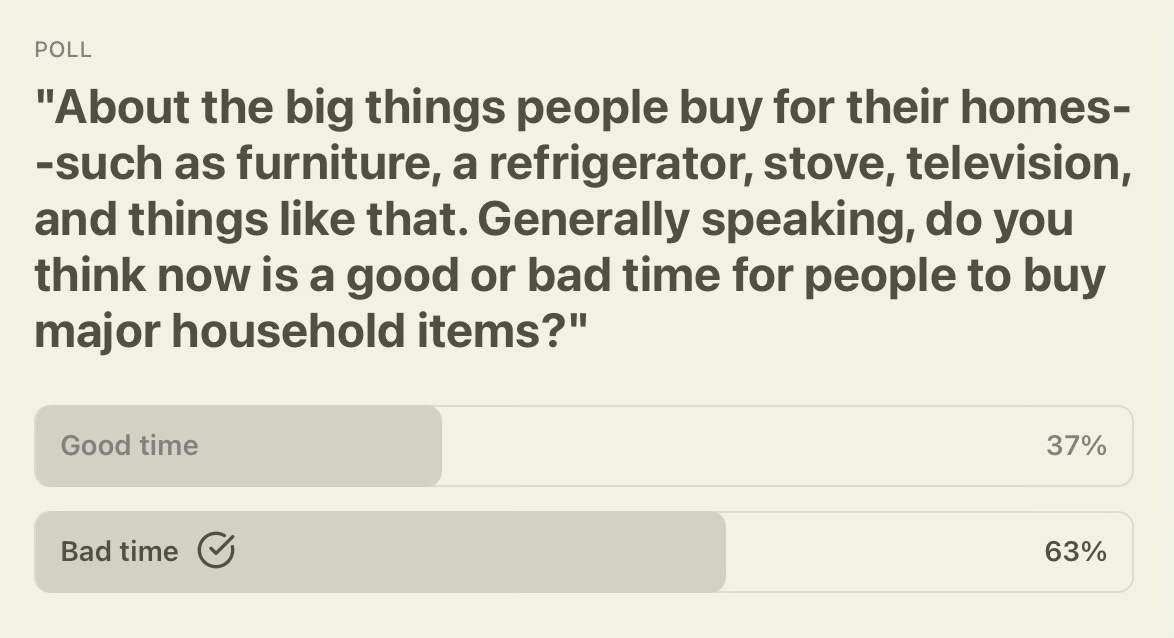
And, finally, here are the responses to each of the five questions by DECADE SEVEN’s participating readers: